In the last weeks, GeoE3 has been working to develop an integration platform by introducing datasets and functionalities for the 3D visualization of buildings. Access was given to the first test dataset of 3D buildings from a limited are in the South-Eastern region of Finland as well as a 3D buildings dataset from Estonia with complete country-wide coverage. Both datasets were stored on our internal GeoE3 cloud platform in a 3D City DB database. A WFS implementation provided by the TU Delft is used to get access to individual building’s 3D geometries in CityJSON format (using the WFS FeatureID query). It is planned to give public access soon to the demonstrator, after a period of testing and validation.
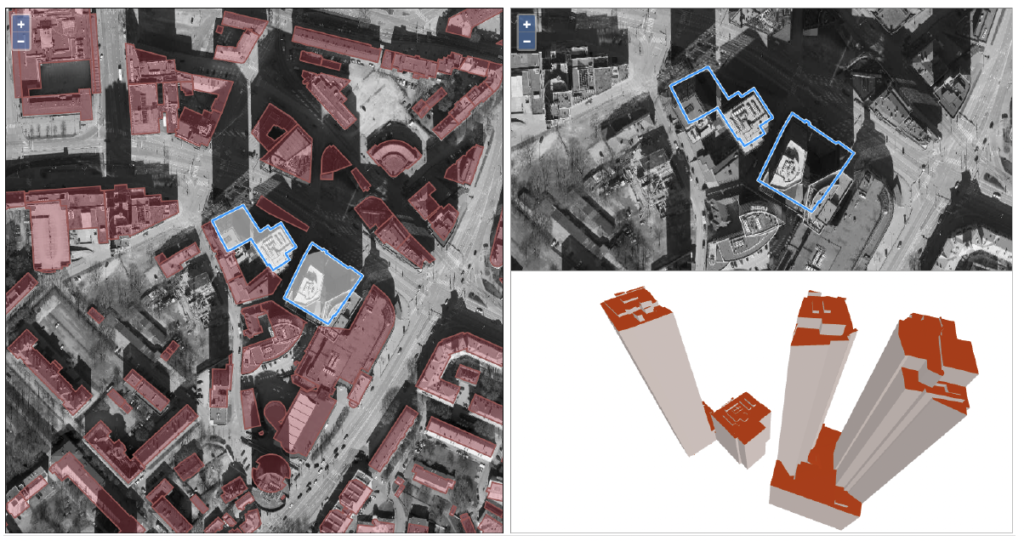
For the technical realisation, on the client side, a software component was added to the existing GeoE3 client for 3D visualization of the CityJSON-encoded building data. For this functionality, a software module, again developed by the TU Delft, is employed. This module is called ‘ThreeJsViewer’ and it is part of the TU Delft’s component package ‘CityJSON Vue components’. The 3D viewing component is integrated to the GeoE3 building dashboard that we have been developing (see images below). In addition to the traditional 3D viewing controls of the component itself, the visualization can also be directed by hovering cursor on top of the main map window. The camera position of the 3D viewer is set to the ground location of the cursor in the main window. If the cursor is hovered in the detail map view, the camera height is taken from the DSM (if available) thus facilitating natural viewing positions.
The viewing functionality was enhanced by allowing several buildings to be selected (one by one), and thus be explored simultaneously in the 3D window. The time of daylight computation is always done for the last selected building, and the result added to the detail map view. The breadcrump trail above the map views also always reflects the last selected building.
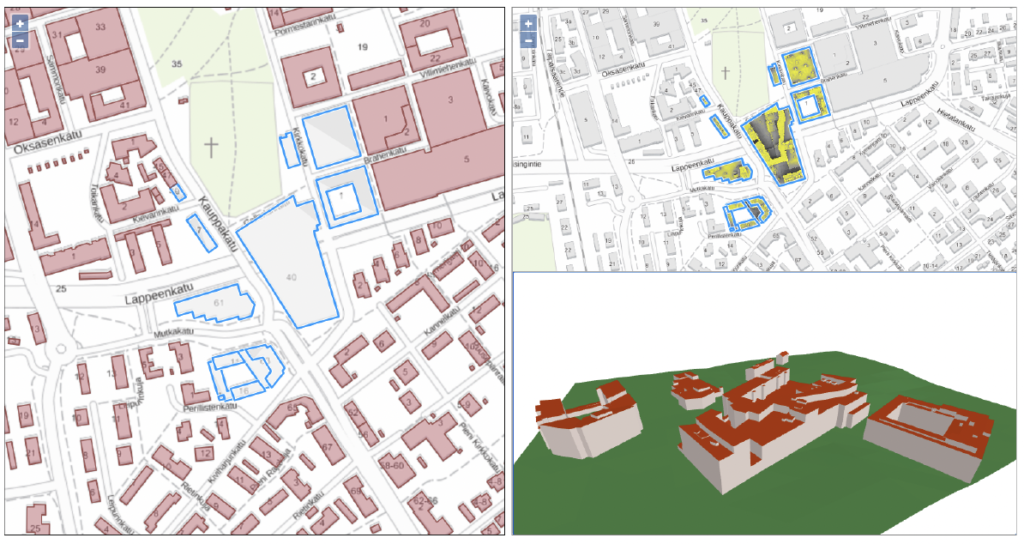
In the Finnish dataset, the semantics are explicitly included (differentiating between surfaces belonging to the roof, walls and floor of the building). In the case of the Estonian dataset this is missing. In the visualization component, a functionality was added to separate walls from the roof/floor in the Estonian dataset by the direction of the normal of the surface (as walls are mostly vertical). In the case of Finland, also a limited area of DTM is requested around the building and added to the 3D view, together with the buildings. In the Finnish dataset, the ID of the buildings was missing, so it had to be transferred from the 2D dataset in a preprocessing step by spatially overlapping the two datasets.
The work on the 3D buildings continues by exploring the possibilities for adding similar functionality for the remaining participant countries, either by accessing new 3D datasets or by adding a process for on-the-fly creation of the 3D geometries.