
Looking for answers as part of scientific research, technical work or even personal curiosity can sometimes be hindered by languages, borders, or lack of trust in data you don’t understand. In the case of geospatial data in Europe, access and use of this data are usually very nation centric.
Yet, to expand the reach of our work and improve its efficiency, having access to a wider range of data could be a game changer.
Goals and Motivations as Part of GeoE3
To tackle these issues, the GeoE3 project was created with goals that include the development of new quality tools and the process simplification of discovery and evaluation of geospatial data and APIs from a selection of European countries.
Having produced a singular platform able to render European geospatial data, GeoE3 aims to make it simpler for anyone interested to find and browse European geospatial data as well as asses its quality before deciding to use a given dataset.
One answer to these goals is the development of a quality dashboard that would serve as a visual representation of quality evaluations done for data involved in the GeoE3 platform. I wanted this new tool’s design to be user-friendly and self-explanatory, no matter the user’s background or expertise in data quality, so that data quality and metadata can be more accessible, easier to assimilate, make sense of, and therefore use for clients of the platform.
Understanding and Identifying Quality Metrics
Developing the quality dashboard was personally challenging, as data quality concepts are manifold and complex. To enhance the evaluation of dataset suitability, I identified quality metrics that enable the quantification of quality evaluation results and can be utilized to interpret raw quality evaluation results.
The most technical quality metrics are helpfully defined by ISO standard, such as completeness, logical consistency, or temporal quality. Other metrics, such as interoperability metrics, have been established by previous research conducted as part of the project, including the creation of an interoperability map . Those metrics were complemented with a more user-focused evaluation of the data by highlighting reliability or relevance.
As a result, the dashboard was designed to present three panels on the home page to cater to different user profiles (cf. Fig. 1).
Developing an Interactive Quality Dashboard
To simplify quality evaluations analysis, I assigned scores to identified quality metrics based on their evaluation, allowing users to select datasets based on quality ratings, similar to selecting a restaurant based on its star rating.
Additionally, I created a hierarchy of quality elements to aggregate multiple quality metrics by theme, with each level receiving a quality score.
The interactive quality dashboard was designed using Microsoft Power BI ; I am currently working on implementation by expanding my coding skills to develop a program that extracts and scores quality information from metadata, APIs and quality evaluation software.
To address missing quality metrics in metadata, I created a reference file for data producers that, if incomplete, lowers the dataset’s overall score, incentivizing the inclusion of comprehensive information.
Room for Improvement: Quality Results Integration and User-Defined Search Function
Although the current design of the quality dashboard is expected to be delivered in April 2023, there is still room for improvement.
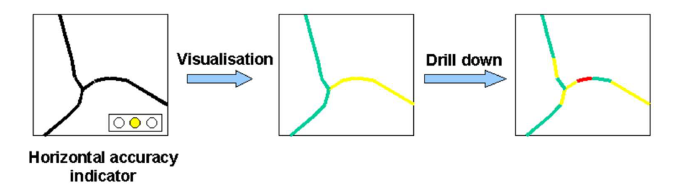
A solution to make the tool and its results more appealing is to integrate the quality results with the map by using a color code that transcribes the quality scores (cf. Fig. 2). Additionally, a search function for datasets that considers quality parameters set by the user could also be included to further enhance the tool’s capabilities.
My Background
I started working on this project in early 2022 as part of my Master’s thesis for the National Land Survey of Finland. After graduating as a Surveying Engineer in France, I was able to stay at the NLS to see the end of the development of the quality dashboard.
As a non-expert in data quality, I approached the project from the perspective of novice users, resulting in a tool that I believe can assist users in identifying suitable datasets that fit their needs. Highlighting the quality of datasets allows geospatial data users to work faster and use data more efficiently.
Looking for Further Information
The service will be available during Spring 2023 on the GeoE3 platform. In the meantime, if you want more information about the GeoE3 dashboard or would like to see it in action, please do not hesitate to contact me (camille.cossec@nls.fi).
Camille Cossec,
Spatial Data Specialist,
Finnish Geospatial Research Institute